New Computer Fund

Thursday, September 13, 2012

Catch a Wave

My pet peeve with climate science is that there is no good definition of "normal".  Climate and weather are constantly changing.  Since it changed before mankind had a chance to do much, a large portion of the change would be natural.  With man kind modifying nearly 10% of the total area of the Earth or nearly 33% of the land area of the Earth, just for agriculture, mankind has undoubtedly had some impact on climate.  Comparing current climate to past should help separate "Natural" from Man made climate impact if we could more accurately determine what past climate actually was.  Above is the University of Alabama, Huntsville Microwave Sounding Unit Lower Troposphere temperature  data using a 1978.99 to 1990.99 average reference baseline with centered 61 month (5year) running mean smoothing.  Using this data base, since the start of the satellite era, the global lower troposphere has warmed by ~0.3 C degrees and the northern hemisphere land has warmed by ~0.5 C degrees.  Most of the warming has been over land and most of the warming has been in the northern hemisphere.  Using this baseline, only one point in the 1985 time frame has all of these data series at the same relative temperature anomaly.  Comparing the satellite era data to the common 1961 to 1990 paleo reconstruction baseline or the 1951 to 1980 surface instrumental data baseline would indicate a range of ~0.2 to ~0.5 degrees at the end of the comparison which was 2012.25 for this chart.

Using the same data set but regional data instead of the global and hemispherical, with the exception of the northern extra tropics, the range would be 0.1 C degrees if the data were combined to any paleo climate reconstruction of the surface instrumental data set.  This chart does not include the polar regions because the satellite data is incomplete.  The surface station data is also not complete in the polar regions, so to make an apples to apples comparison of satellite data to surface instrumental data or paleo climate reconstructions, the polar regions should not be included in direct comparisons.  Note that in this chart, there is no point where all the data series share a common anomaly.

This is the same data with the averages removed and the NoExt shifted to the secondary axis.  Mean value lines for the ocean portion of the data was added.  Note that the SoExt and NoExt mean values are aligned indicating that the NoExt, "caught up" and passed the SoExt and Tropics.  Climate has internal oscillations that impact different latitudes at different times and in different amounts.  If I re-scaled and averaged these data sets allowing for this relative "wave" of oscillation, the mean of the globe, excluding the polar regions would be approximately 0.08 C degrees above the 1979.99 to 1990.99 mean.  Whether that is the most appropriate mean is hard to determine, but 0.08 versus 0.30 is a huge difference considering total global warming from the start of the industrial age is estimated to be approximately 0.8 C degrees.

Picking the wrong "normal" temperature by catching the wrong internal oscillation "wave" could result in an error of 0.22 C degrees in only a 33 year period which could be rather embarrassing.  Averaging or interpolating data without allowing for the 0.22C natural oscillation of the past 33 years could result in an inaccurate estimation of current global temperature and averaging paleo climate without considering the natural internal oscillations could result in an inaccurate estimate of past climate.  Errors of that magnitude would make it easy to confuse cause and effect.

Since the satellite era data is arguably the best we have, the satellite era should arguably be the default choice of baseline for comparison to past climate, whether determined by paleo reconstruction or surface instrumental readings.  You really wouldn't want to catch the wrong wave would you?

Since my personal bias is that stupidity caused most of the man made climate change, the chart above is for what I believe is the stupidest of land use programs.  The former communist Soviet Union's virgin lands campaign which started in 1953.  There are linear regressions up to and after the 1953 brain fart.  Notice that the BEST data Tmax was flat as possible before the collective farming and enslavement initiative.  If you compare the before and after slopes, both increase by ~.2C degrees per decade after the start of the rape of some of the most sensitive high Steppes in the world.  In this particular region of the world we have things not related to fossil fuel use increases in atmospheric CO2 levels.  We have ambitious land use.

To compare apples to apples, here the BEST data is shifted to the p.b.l. with 61 month (5 year centered) smoothing.  The Tmax very closely matches the slope of the UAH NoExt data and the Tmin slope appears to be catching up to the Tmax.  CO2 climate forcing would have a greater impact on the Tmin in case you were wondering.  Prior to the Virgin Land debacle, Tmax was stable and Tmin was rising.

Just to complete the picture, this is the BEST data for Kazakhstan compared to the NoExt oceans.  The northern hemisphere oceans were warming well before the "global warming" mania due to recovery from the colder period of the Little Ice Age.  The warming in Kazakhstan accelerated with the collective farming of over 30,000,000 hectares of virgin steppe being converted to wheat fields with no consideration of the impact of erosion in the near desert environment and the majority of the water flow to the once 4th largest fresh water lake in the world being diverted for irrigation.

Most of the organic carbon in those virgin lands was lost to erosion in the communist equivalent to the dust bowl.  The ability of those lands to sink carbon was lost for decades and is only now recovering because the agricultural failure was finally admitted by the no longer communists in charge.


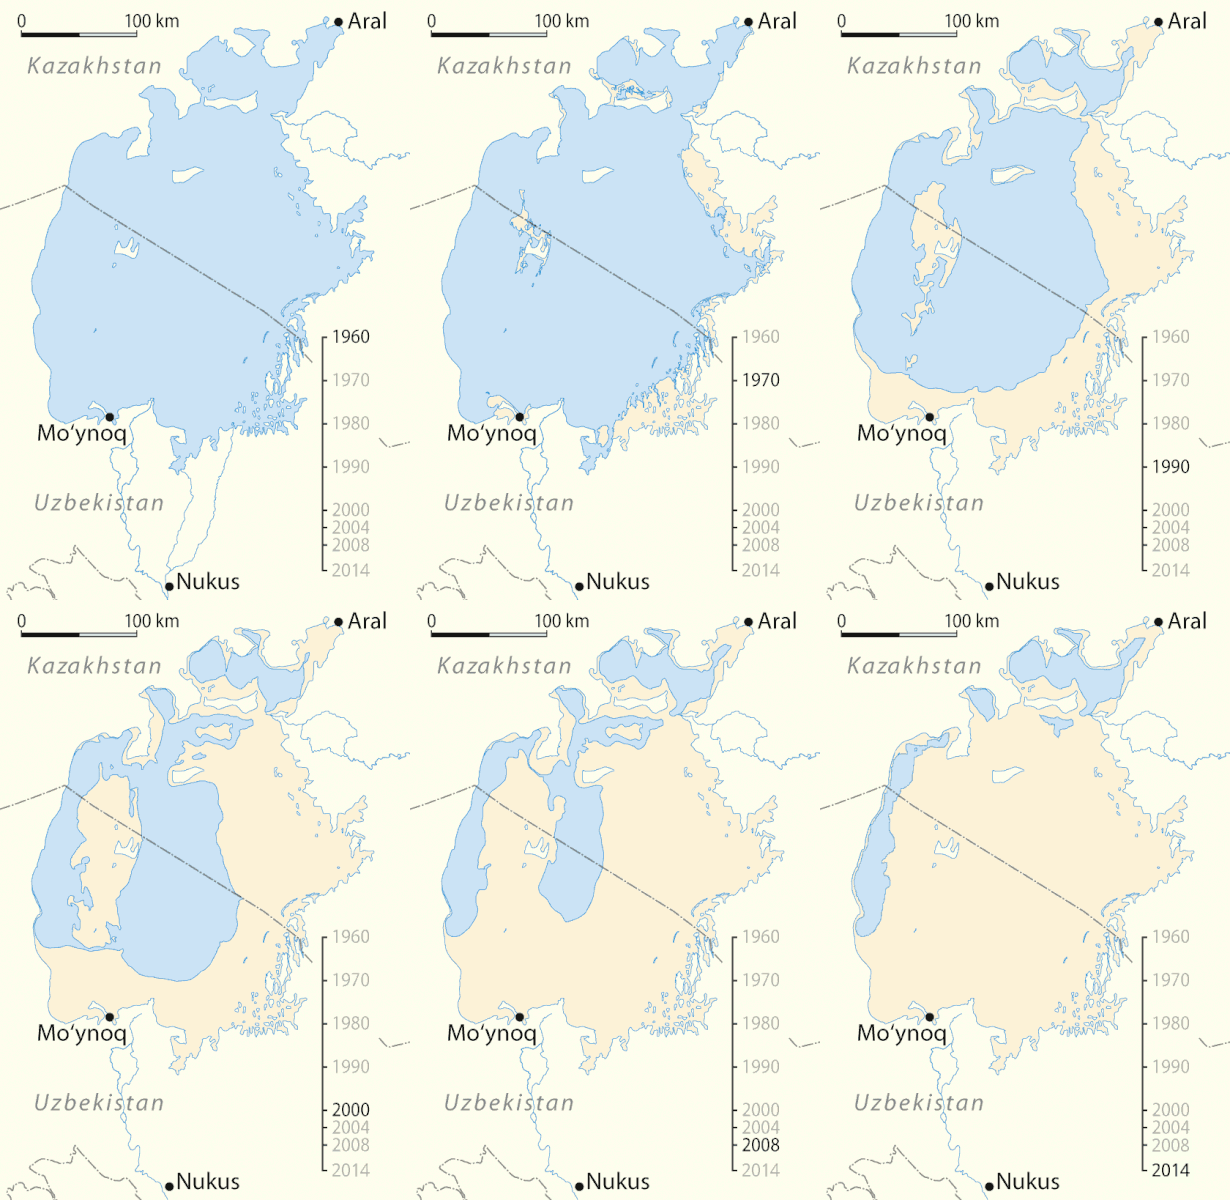
From Wikipedia, Aralkum, the desertification of Virgin Lands.  Is that because of CO2 or because of stupidity?  If you chose the wrong baseline, it could be an effect not a cause, pretty much like the catching the wrong wave.  It would appear that for one region of the globe that was warming faster than the rest of the globe, land use may have had a negative impact on climate.

Tuesday, September 11, 2012

All Else Remaining Equal

Carbon dioxide in the atmosphere is expected to increase heat energy retained in the atmosphere by 1 to 1.5 degrees C for each doubling of concentration, "all else remaining equal".  All else remaining equal is a rather large assumption.

The Berkeley Earth Surface Temperature project was started because of questions that Dr. Richard Muller had about the transparency and accuracy of the surface temperature record used to determine the degree of warming due to increased carbon dioxide.  The project provide another independent estimate of surface temperatures which is fully open for inspection and has some very user friendly features.  Having Tmax and Tmin, the maximum and minimum recorded surface temperatures is really trick.  The chart above is Best versus the oceans.   It is a little hard to read.

To make it easier to see, here is just the Northern Hemisphere starting in 1900 using a 5 year centered moving average with a 1961 to 1990 baseline.  The 5 year averaging is just to reduce some on the noise without lossing too much of the signal and the 1961 to 1990 baseline is to make it easier to compare the instrumental data to the numerous plaeo climate reconstructions of past temperatures.  Note that the light blue curve is Tmin.  The slope of this curve is more consistently rising from the 1900 start than the Tmax and sea surface temperature(SST).  The end value of Tmin is approximately 1.8 degrees C warmer than it was at the start.  The greatest rise in the Tmin slope starts about 1970 and is approximately 1.3 degrees.  The start of that slope followed an approximately 0.3 degree drop beginning around 1960.

This chart is for the southern hemisphere.  The Tmin curve in the southern hemisphere also has a more consistent rise from the start in 1900.  There is not a much increase in the slope after 1970.  The SST and Tmax curves in this chart have a more uniform increase in temperature.  The total increase in the Tmin is the largest of the three and is approximately 1.5 degree maximum change.  Unlike the northern hemisphere, most of the increase in Tmin was before 1980.

In this chart there is a break in each series in 1965, approximately the maximum slope of both series with linear regressions for both segments of both series.  In the northern hemisphere, the change in slope is 3 times the initial slope.  In the southern hemisphere the slope doubled.  The northern hemisphere contains nearly 70% of the land mass which makes up about 30% of the total surface area of the globe.  The southern hemisphere contains about 30% of the land mass.  Coverage of the southern hemisphere is not a good as the northern hemisphere and the majority of the temperature data in the southern hemisphere Antarctic region, nearly 9% of the total global land mass, only started in earnest in the late 1950s.  There is some uncertainty, but the data is about the best we have.

Comparing the hemispheres, it doesn't look promising that "all things remained equal".  The CO2 increase should have its largest measurable impact on the average minimum surface temperature and should be greater over land than the oceans.  With the southern hemisphere having much more oceans influence than the northern hemisphere, the doubling of the slope in the SH versus the tripling of the slope in the NH is not unexpected.  The slope of both hemispheres prior to the 1965 change, would not as likely be due to CO2 increases.  As a rough estimate, half of the SH warming would be unrelated to CO2 forcing and possible one third of the NH warming would also be unrelated to CO2.  The curve in the SH series from 1965 to 2010 has the appearance of a dampened response, not in keeping with CO2 forcing, which implies more natural variability than generally mentioned by Anthropogenic Global Warming affectionadoes.

While swaying the "believers" in AGW is unlikely, rational skepticism of AGW being primarily due to CO2 forcing appears logical deduction not denial of proven science.  The "believers" perhaps should spend some time analyzing their own motivations.

Added Tmax and SST for the curious:


Saturday, September 8, 2012

Satellite Era Baseline for Proxy Reconstructions

I have been told that this cannot be done.  So I will take some baby steps showing what is going on with this crazy plot of mine.

Neukum Et Al. have a Southern South America temperature reconstruction that I think is a pretty decent reconstruction to use.  I am sure it is far from perfect, but it looks useful.  The Satellite data is arguably the most accurate of averaging large area temperatures, though the data is not a surface measure, it should naturally average variations in surface temperature.  The oceans, due to their larger thermal mass would also naturally average temperature fluctuations.  So starting with the better data and working back in time makes perfectly good sense to me.  We are after all comparing less than perfect indications of temperature.

This is the baseline that I will be using, 1979 till present for all data sets.  The Neukum et al. ended in 1995, so this plot is just to show where the 1979 to 1995 SSA reconstruction baseline compares with the UAH SH oceans 1979 to 2011 baseline.   The mean value of the two is a close to a perfect match as you can get. All of the data sets listed were adjust to the 1979 to present baseline, present being through 2011.

This plot extends the SSA, GISS and HADSST2 data back to 1950.  The growing season temperatures of the SSA reconstruction still fit well with the HADSST2 southern hemisphere data which should be more closely related to temperature changes in Southern South America.

Starting in 1850, there is still a good fit.
This is the full series for all of the data.  Without smoothing any of the data, the hockey stick does not look all that intimidating.  The average for the satellite era is about 0.35C above the average of the  SSA and HADSST2 SH series.  The dark red SH UAH Oceans mean value line appears to be in the "high" normal range of the Neukum et al. SSA reconstruction.  So while this method of "splicing" instrumental data to paleo reconstructions may not be statistically perfect, it should not be overly misleading or biased when attempting to estimate ocean temperature changes.

There are a few other southern hemisphere and tropical temperature reconstruction that should be fairly closely related to ocean temperatures which should be a reasonable baseline for estimating past global temperature change not overly related to land use and ice sheet changes.