New Computer Fund

Thursday, March 28, 2013

SteveF and the PDO versus North Atlantic

SteveF is a fellow resident of the not as tropical as they once where Florida Keys.  SteveF is a smart guy with a lot more statistical savvy than I have, but that doesn't mean I agree with everything he comes up with.  Recently he had a guest post on Lucia Blackboard where he considered using accumulation of PDO influence on climate.  I personally think that the PDO or Pacific Decadal Oscillation is important, but since it is just a lag response to the ENSO or El Nino Southern Oscillation, that there are better ways to skin this particular fish.

I think we need a better index.  Looking at the Drake Passage and Bering Strait Choke points for ocean heat distribution I thought that he should use something like a PDO modified for absolute sea surface temperature or energy versus a NOA (North Atlantic Oscillation) also modified for absolute SST.

Above is a comparison of the North Atlantic SST with CRUtemp 4 land only temperature series.  The correlation between the two according to my spreadsheet is 55.4 percent with no lag consideration at all.  The comparison is just anomaly using the 1981.90 to 2013.083 monthly baseline which is all the Reynold's OI v2 data set I used had available.  55.4% correlation is not super great, but pretty darn close.  If it was better, I would be more suspicious of something, mainly me and my spreadsheet, being amiss.

Since the North Atlantic region is truly accumulative, it is provided additional energy by the THC mainly from the southern ACC region, I would think that the North Atlantic would make a better choice for a Global Temperature index than the PDO which is noisier and involves more inconsistent lags.

Comparing the North Atlantic to the MEI, I found there is an apparent lag of roughly 8 years with the Atlantic as a whole.  It may be fun to compare the MEI, PDO and this North Atlantic region.

Since his post has comments closed, I thought I would just post my thoughts here.

UPDATE:  With what appears to be a fair correlation between North Atlantic SST and Global Land temperatures I thought I would add this chart:

There is a little issue brewing about SST proxy reconstructions.  The depth of the core sample may cause the reconstruction to be less SST related and more actual depth related.  The core used in the blue, is MD99-2275:  66°33'N, 17°42'W, 470 m water depth while the orange is RAPiD 21-3K: 57°27.09'N, 27°54.53'W, 2630 m water depth.  I used anomaly instead of actual temperature because of the controversy, but with the variability of the shallower reconstruction being more than the deeper, is what one would expect both due to location and depth.


Just for grins, this includes the CRU4 Global and NH temperature series using the same 1880 to 1968 baseline used for the reconstructions.  It is apples and oranges, but since the satellite SST correlates to 55.4% with CRU4, it might make for interesting conversation.

Tuesday, March 26, 2013

Is Climate Chaotic or Not?


This is a classic argument, is climate chaotic?  My position has always been that it depends on the degree of accuracy you want.  Climate is chaotic in that is has unpredictable events over different time scales, but if you are just looking for a ballpark estimate, that is doable.  The above is a comparison of five Atlantic ocean paleo SST reconstructions.  The Kim and Reuhlemann reconstructions are in the tropical Atlantic on each side of the equator.  They are the most stable, but you can see there is an antiphase relationship.  Average climate based on those two would be extremely stable since their average is nearly constant.  The lower three include two for the Arctic region and one for the southern hemisphere ACC region.  They are more chaotic as in higher variance and comparing the two Arctic reconstructions, there is considerable phase shifting in a rather small region.  If you average them all out you would estimate a relatively stable climate, but there is more noise.

If you consider that noise climatic weather, then you can reasonably predict future climate.  You have to define what period should be called macro-weather or micro-climate.  30 years by these reconstructions would not be climate, but either the Macro or Micro version of your choosing.

This is just the three higher latitude reconstructions.  In the top two, there is roughly five degrees of temperature range, but there is northern hemisphere land mass that responds more dramatically to change versus the southern hemisphere when land and polar amplification is minimal.  So in the NH that +/- 2.5 C fluctuation could produce +/- 5 to 10 C higher latitude fluctuations depending on the magnitude and duration of the events.  That region is only 25% of the global area so with +/- 5 C fluctuation there, could be +/-1.25 C global climate fluctuations.  If you are predicting climate to +/- 1.25 C, then you could have reasonable confidence in your predictions.  The more precise you want your prediction to be, the less likely you would be correct.  

Now notice the roughly 5000 year upward curve in the SH reconstruction by Nielsen versus the roughly 4000 to 8000 year downward curve in the Bendle reconstruction.  At the end they become synchronized near the time of the Little Ice Age.  Now there are two polar regions which would have a combined climate impact that could exceed the +/-1.25 C range base solely on the NH region.  Now you would either need to increase your Macro or Micro time frames or expand the uncertainty margin for your predictions.  

There are physical reasons for the fluctuations, forcing and lags in distribution in a thermally asymmetrical planet.  As long as you allow for the proper lags at the proper times, you can improve your precision.   Ignore the lags in distribution and you are likely to get egg on your face.  

Your call, is climate chaotic or not?

UPDATE:  Those lags are pretty important.

That is the ENSO index normalized just to see fluctuations compared to the Atlantic SST.  98 months or just over eight years produces the best fit.  From 1990 to 2005 there was considerable NH warming.

Not too surprisingly, most of that warming was in the NH North Atlantic region.  Imagine that?

Saturday, March 23, 2013

Zonal Flux using the Oceans

 The meridional flux changes started with the Drake Passage opening tend to drive long term climate change.  With the Choke points at the Drake Passage and the Bering Strait metering the equalization of zonal energy, the Atlantic Ocean due to the Thermao-Haline Current (THC) takes centuries and longer to rebalance with the rest of the global oceans (see Brierley & Fedorov 2010).  As estimated by the Toggweiler et al. ocean models and the paleo-ocean reconstructions by Nielsen et al., frequencies of 150 years and long should be common.  How much impact there is over the longer term is estimated at 3.2 C degrees for the meridional impact and 0.6C for the zonal impact of the ocean circulation changes some few million years ago.

The meridional "oscillations" or recurrent patterns over long time scales are fairly easily explained by the shift in the ocean thermal equator versus the physical equator.  The chart above shows the estimated total energy flux per 5 degree latitude band in blue versus the difference in meridional flux by latitude band.  With the Antarctic isolated by the ACC created with the Drake Passage opening and the lack of liquid ocean below the ACC, the mean altitude of the Antarctic ice cap (~2000 meters) produces nearly a 20 degree abrupt temperature gradient with the dry adiabatic lapse rate.  This high and dry region is approximately 9 percent of the total surface area of the Earth.  The Blue curve then is effectively the moist air/liquid ocean envelop that would produce the radiant impact of changes in atmospheric chemistry.  With the Antarctic high and dry, a dry air only model of CO2 impact would be required to produce reasonable estimates.

The zonal imbalances are more "weather like" in their impact.

This chart uses the Reynold's OI v2 data in 60 degree longitude bands to show the noisy relationship of zonal regions over the past 3 decades.  The anomaly is created be subtracting the SST data from the seasonal signal of each band.

This chart shows the raw data for each band in estimated Wm-2.  The Pacific and Atlantic zones show the seasonal sine wave with the India Ocean region (0-60E) show a more complex combination of signals.


The Eastern Pacific and the Middle Eastern Latitudes have the largest noise component (weather) of the zonal regions.  The Eastern Pacific has the great ocean area of these two regions and should have more climate impact because of the greater thermal mass.

The Western Pacific has less noise and would appear to be a better proxy to climate change instead of weather changes.  In this chart the warming from beginning of the data to 1998 is clear as is the "pause" or plateau in warming following the 1998/1999 El Nino climate shift.

With the Western Pacific as a control region, the Western Pacific minus the Atlantic, the longer term oscillation indicator, could be a good indication of zonal impact on climate.  From the ~1994 valley at -2 Wm-2 to the ~1999 peak at 2 Wm-2. global temperatures as measured by HadCRU increased by ~0.2 C degrees.  With virtually no change from the ~1999 period to the ~2012 period, there is likely more Atlantic influence than Western Pacific on the estimated "average" global surface temperature.


Focusing on the Atlantic band in this chart, the overall trend is 0.639 C per century likely caused by thermal energy transfer lag created by the Drake Passage and Bering Strait choke points.

It would appear there may be much more to climate change than well mixed greenhouse gases.

Update:

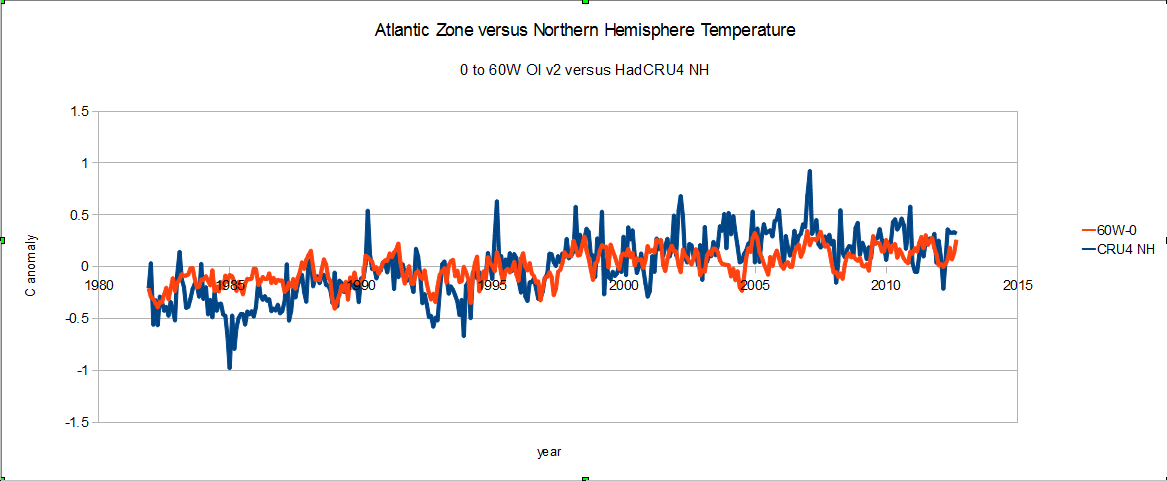
While I am more concerned with the energy imbalances many like to see temperature anomaly.  This compares the 0-60W Atlantic SST zone temperature to the HadCRU4 Northern Hemisphere surface temperature anomaly.   There is a pretty fair correlation as you can see and also there is a difference in the trends.