I have the CMIP5 tas or surface air temperature and tos or ocean surface temperature plotted with tas on the left axis and tos on the right axis. The reason is to show how there is little difference between the way the models consider volcanic impact on the air or ocean.
This comparison of CMIP5 tas and Berkeley Earth's surface air temperature indicates that the models don't do a bad job with surface air temperature. The models do start about a degree lower than Berkeley, but there is no official surface air temperature so Berkeley is just for reference.
The oceans cover the majority of the surface though and have the most energy. I still would say the models do a fair job, but notice how the volcanic forcing doesn't match nearly as well with the lower specific heat capacity air. This only has an error range of about +/-0.25 C, but because of the warmer temperatures and ocean latent heat the energy error could be much higher. Just radiant wise the error is about +/-1.4 Wm-2 and it is difficult to quantify the latent.
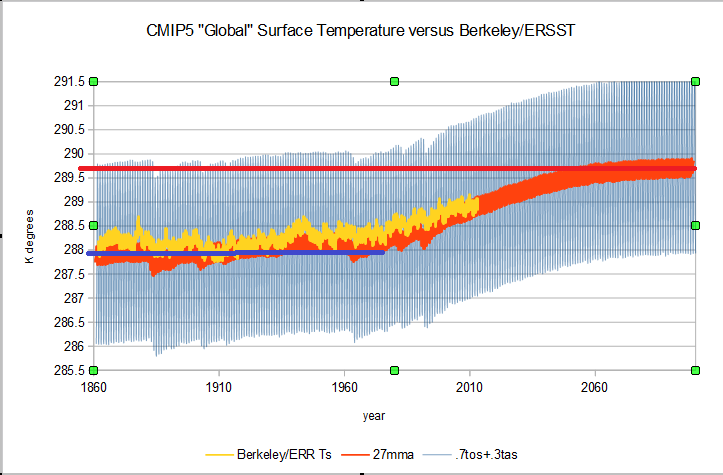
When you combine the tas and tos using the ratio 0.3:0.7 for land and ocean for both the CMIP5 and instrumental data you get this. I included the red and blue lines to indicate the approximate "sensitivity" estimated for the RCP4.5 scenario. Since the biggest response error is in the ocean and the largest factor is the oceans, the models miss mainly because they don't "get" the oceans.
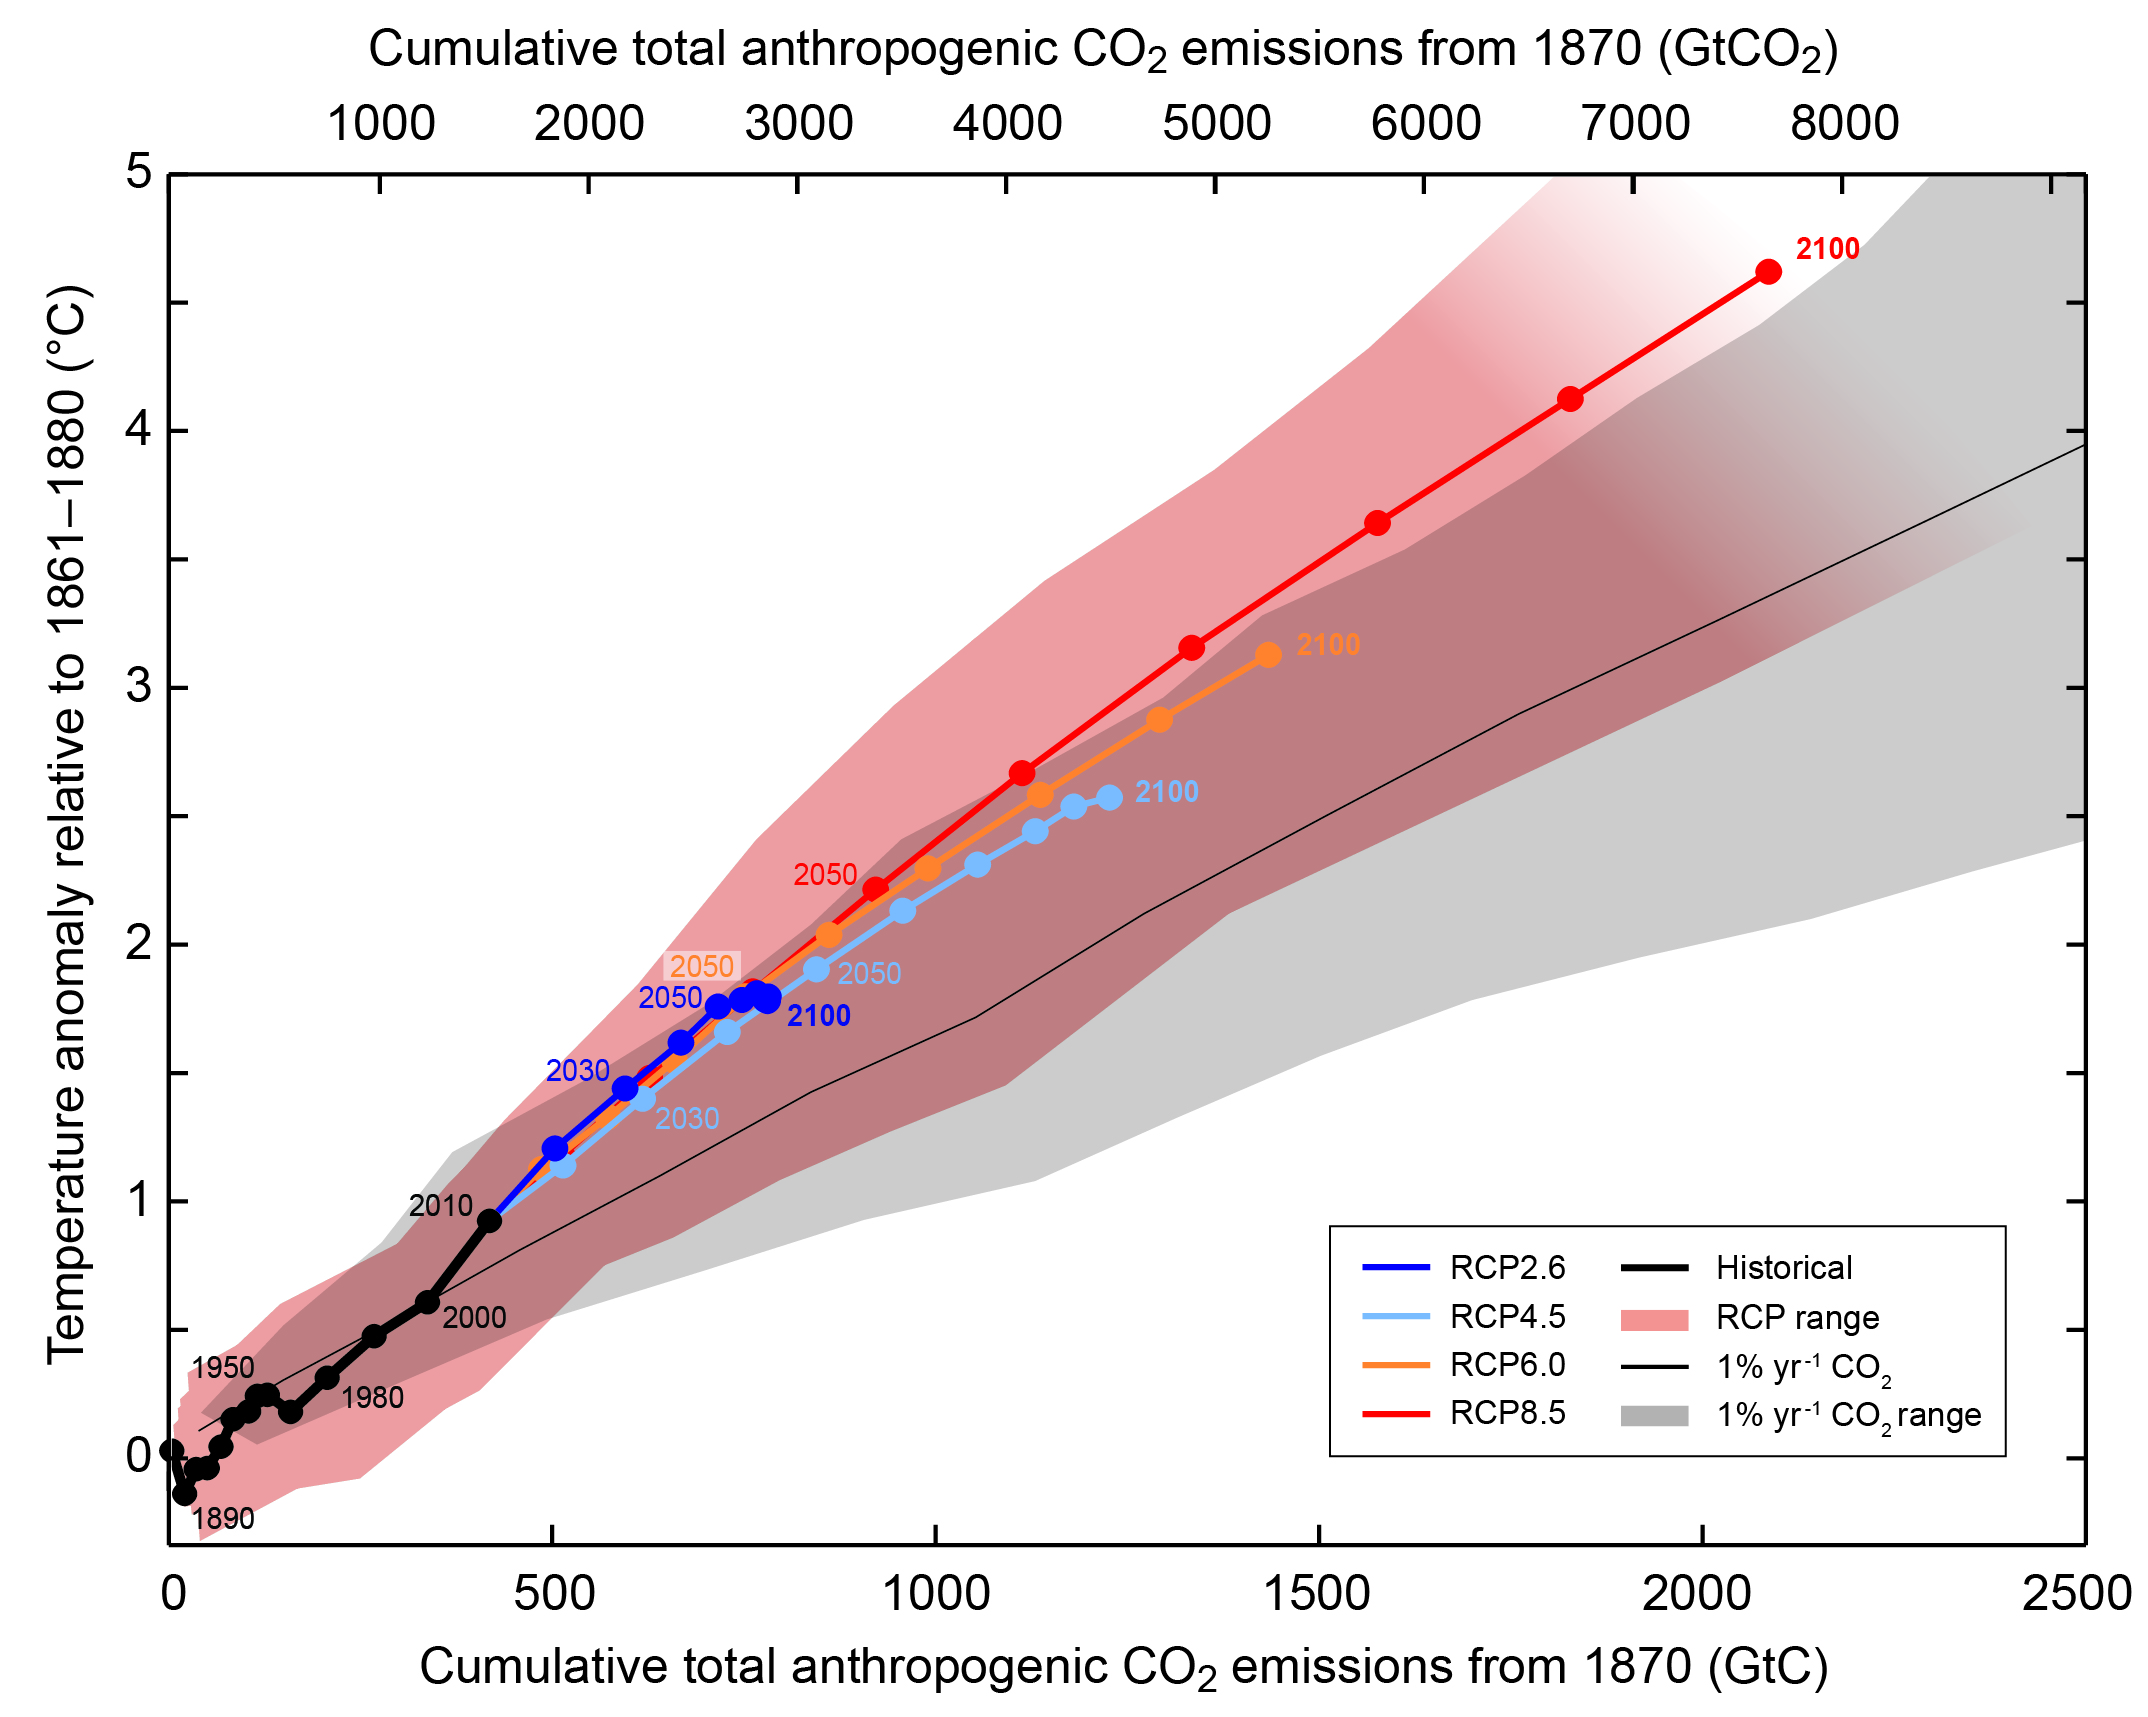
The graphics I created don't look as ominous as this IPCC AR5 graphic. The RCP4.5 scenario is in light blue and 2100 is about 2.5 C above the approximately 1880 start year. My charts start in 1854 to 1861 depending on the data set and pre-1880 is when one of the largest misses occurred.
If I start in 1880 the "historical" or instrumental data begins at about 288.2 K degrees and the modeled minimum is about 287.4 K degrees. "Warming" in the historical is close to 1 degree at the end of the series about 2013.5 due to smoothing and the "projected" warming is about 0.75 C more than that. The Projected" warming of the CMIP5 mean RCP4.5 run looks more like ~1.7 C +/-0.2 than 2.5 C. The IPCC chart says it uses an 1861 to 1880 baseline.
Taking the same baseline you can see that it makes the model look better, but from the 1861-1880 baseline there is still only about 1.75 C of total warming expected. Close to half of that warming is already out of the way.

Berkeley Earth's kriging method allows for a longer instrumental temperature series with of course increasing error. Including the New Crowley and Unterman 2013 volcanic forcing reconstruction provides a different view on what impacts may be neglected in the 1861-1880 baseline. This uses Berkeley Earth 20S-20N in hopes of getting better indication of tropical SS. 1861 is a bit of an odd choice. Hadley center products start in 1850. 1861 may have been a compromise between the various temperature product start dates. In any case, baseline choice can have a few tenths of a degree impact on "warming" while actual temperature comparison reduces that potential bias. Scaling Berkeley to "simulate" SST though with its increasing error and the baseline issue doesn't provide anything more than a tease about what might have been.

but [perhaps a tease can be helpful. The scaling required adjusting the baseline and the trend slightly to fit the majority of the more accurate SST data. The divergence at roughly 1900 might be real or might be an artifact, but is is close to the uncertainty range of both products.
SWo why would I waste my time with all this?
The Marotzke and Forster 2015 Nature article compares models with HADCRUT4 "surface" temperature. The HADCRUT4 data is about 70% SST and about 30% land surface temperature. To get the best match of models to observation I have to create a combined 70% SST and 30% land model product since the Model tas appears to be a real attempt at a 2 meter or some real surface temperature. There isn't an equivalent observational product. Since most of the model errors appear to be in the SST portion of the programming, it makes sense to me to compare worst to worst before getting into fantasy to fantasy. If the Berkeley "scaling" is acceptable, that would provide some out of sample data for Marotzke and Forsester to expand this research "globally" or just land only if they don't like the scaling. Either way it would be nice to see apples with apples.


No comments:
Post a Comment