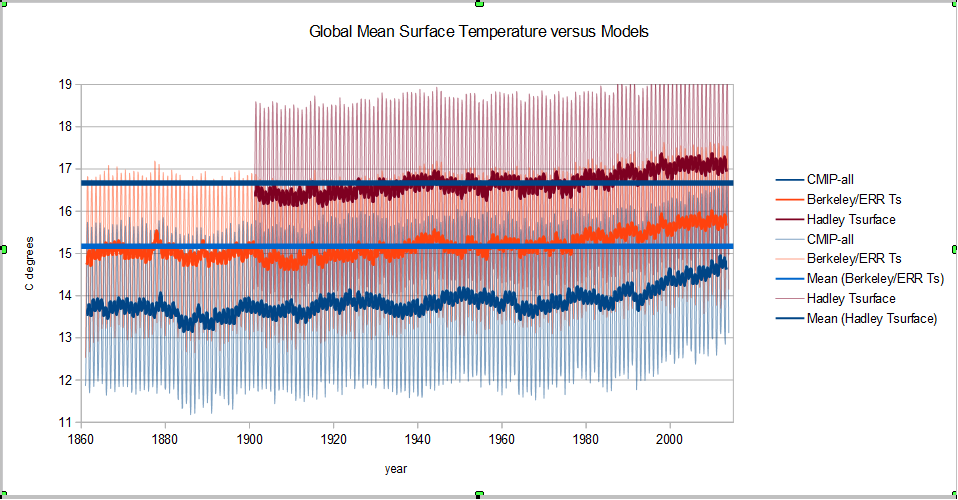
This is "a" rendition of the global mean surface temperature in C degrees. The green in the background is Hadley products HADISST and CRU Ts, ocean and land temperatures in C degrees using 70% ocean and 30% land. The yellow is Berkeley Earth Land and ERSSTv4 in C degrees and combined with the same 70/30 ocean/land ratio. The blue curve is the average of the two with a 13 month moving average and the orange is just the average. The mean of hadley provides the upper bound and the mean of Berkeley-NCDC the lower bound. The actual globale mean surface temperature should be somewhere in between.
If any of the grand poohbahs of climate science have something better, break it out bubba.
This is the CMIP model runs for global Ts, the orange is all of the means of the 107 climate models available at Climate Explorer and the blue is the model mean with seasonal cycle intact.
Here is all of the above on the same chart with the same 13 month smoothing. You could say that Hadley Center is completely incompetent and just use the Berkeley/NCDC combination to make things look better or you could admit that the majority of the models grossly underestimate actual temperatures, but there is a substantial difference between the three. The thermodynamic portion of physics is pretty anal about temperature accuracy and anomaly as a substitute is only valid for "small" changes. I have yet to see "small" defined to my satisfaction but here is what Berkeley seems to consider "small".
% Estimated Jan 1951-Dec 1980 absolute temperature (C): 8.70 +/- 0.06
%
% Estimated Jan 1951-Dec 1980 monthly absolute temperature (C):
% Jan Feb Mar Apr May Jun Jul Aug Sep Oct Nov Dec
% 2.68 3.28 5.36 8.38 11.41 13.58 14.46 13.96 12.14 9.29 6.15 3.72
% +/- 0.07 0.08 0.07 0.07 0.07 0.07 0.07 0.07 0.07 0.06 0.07 0.06
+/- 0.06C degrees appears to be "small".
If I take the anomaly of the three and center on a common baseline period, the move will not be "small". If you are off by 1 C degree ( 1.8 F degrees) in an energy calculation involving latent heat, you error is substantial greater than if there is no latent heat involved. Latent heat in many instances can be greater than half of the "heat" energy. This poses a major problem for climate models that have to estimate atmospheric humidity, cloud formation and convective heat transfer just to name a few. In order to correct, the model "parameters" have to be adjusted, "tuned", "calibrated" or some other euphemism for fudged.
More on this later.
Update: I use some non standard methods at times for "cheats" since I have a pretty basic Open-office spread sheet on a pretty limited laptop. One of my cheats is sequential correlations. The CORREL() function is easy and if I need to I can compare lagged correlation in a cludgy way, but just a sequential comparison is pretty informative.

For example I have mentioned that kriging or long range interpolation smears SST with Land temperatures. Above is Berkeley's kriged global land data sequential correlated with the NCDC SST data set in blue and Hadley's Ts or land surface temperature with HADISST their SST data set that Climate Explorer has for masking regions. As you can see there is a pretty significance in the two data sets caused by kriging/interpolating coastal surface stations with inland stations. If I want to determine a lag of an ocean event like El Nino on land surface temperatures, I would need to use Hadley because Berkeley would minimize the difference. Long range interpolation is great for some things, not so great for others, so I don't like the idea of the data products becoming to inter-related. Different methods are good.


No comments:
Post a Comment