Since ~1998 the rate of "Global Warming" has decreased. The peak rate of warming was the period from 1976 to 1998 which just happens to correlate with new and improved methods of measuring "Global Warming" and combining, as in "reanalyzing" the data to reduce "uncertainty". By creatively manipulating the data we have determined that we now have data with "almost unbelievable accuracy".
For some odd reason, "almost unbelievable" just doesn't have the same grab that it once had when your parents warned you that if something sounded too good to be true it probably was too good to be true. Convincing people that the "new and improved" methods may not be all they are cracked up to be is not all that easy.
Since the rate of "Global Warming" decreased, "Global Ocean Heat Content" has replaced "Global Mean Surface Temperature" as the go to metric for inspiring urgent action to save the world from the Great and Power Carbon Monster. Kevin Trenberth and company have even produced a new and improved "Reanalyzation" of the "Globe Ocean Heat Content" to stoke the fires of "mitigation now".
The OHC has been reanalyzed so well, that a recent paper comparing paleoclimate proxy derived Pacific OHC indicates that warming in that region since the start of deeper ocean data collection has been10 times (the press release for the paper said 15 times which requires some creative rounding) faster than any other period during the past 10,000 years. That would be "almost unbelievable".
What's a guy to do? Trusted Climate Scientists are saying we are all going to fry.
Let's look at some of the other data. Since the OHC data is in ocean basins both as vertical temperature anomaly and the OHC in Joules times 10^22, I need to separate the ocean surface temperature into the same or at least similar basins. If I did that right, above are the SST anomalies for the southern oceans from latitude 60S to the equator. Notice how the South Pacific has risen 0.4C since 1870 and appears to have a decreasing slope as it approaches present. The Pacific Ocean is the largest so it would tend to have less impact from internal "natural" or otherwise variability.
If I look at the northern oceans I see the same start at 0.4 C below present with a more ragged by similar reduction in slope for the Pacific. Starting around 1990 the Pacific ocean SST rise almost completely stopped and by the looks of it the Atlantic and Indian Oceans "caught up" around 1998. "Catching up" would not be an indication of Anthropogenically caused "Global Warming".
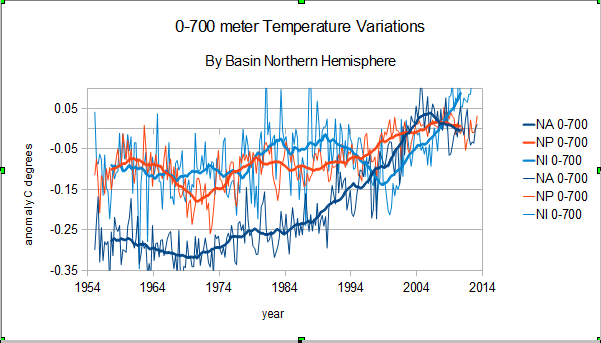
The deeper ocean data starts in 1955. These are the vertical temperature anomalies for the northern ocean basins. From 1955 the huge Pacific ocean 0-700 meter temperature rose by about 0.075 C degress. There was more than three times the warming the the smallest of all ocean basins the Northern Indian Ocean.
In the southern oceans the South Pacific warmed by about the same 0.075 C degrees while the South Atlantic and Indian Oceans warmed by about twice as much.
Prior to the more "activist" Climate Science, there was a period formerly known as the "Little Ice Age" (LIA) where "Global" temperatures where thought to be lower than today due to a variety of "natural" possible influences like volcanic activity and solar variation. Since the more "activist" Climate Science the fka LIA and preceding "warm periods" have been renamed as anomalies and could have virtually zero impact on modern climate because the "physics" of "Global Warming" indicates that "only" CO2 and the Great and Powerful Carbon could possibly have caused so much "rapid" climate change, 0.15 C to 0.65 C, over the past 60 odd years. They are right. Once you remove all other possibilities, that much warming, the high end at least, is "almost unbelievable".
If you look at the Pacific Ocean combined 0-700 meter virtical temperature anomaly you can see the earliest part of the data has a large error range which is to be expected given that data was collected prior to "Activist" climate science.
With every data set indicating less than "unprecedented" warming, one has to wonder why the sudden focus on a botched data set. Normally, someone trying to double check their work would compare as many data sets as possible to avoid an embarrassing error. Could it be they "liked" the results so much they were willing to risk embarrassment? Then perhaps "Shame" is too 20th Century.
Data Sources: KNMI Climate Explore and NOAA National Oceanographic Data Center


No comments:
Post a Comment