The meridional flux changes started with the Drake Passage opening tend to drive long term climate change. With the Choke points at the Drake Passage and the Bering Strait metering the equalization of zonal energy, the Atlantic Ocean due to the Thermao-Haline Current (THC) takes centuries and longer to rebalance with the rest of the global oceans
(see Brierley & Fedorov 2010). As estimated by the Toggweiler et al. ocean models and the paleo-ocean reconstructions by Nielsen et al., frequencies of 150 years and long should be common. How much impact there is over the longer term is estimated at 3.2 C degrees for the meridional impact and 0.6C for the zonal impact of the ocean circulation changes some few million years ago.

The meridional "oscillations" or recurrent patterns over long time scales are fairly easily explained by the shift in the ocean thermal equator versus the physical equator. The chart above shows the estimated total energy flux per 5 degree latitude band in blue versus the difference in meridional flux by latitude band. With the Antarctic isolated by the ACC created with the Drake Passage opening and the lack of liquid ocean below the ACC, the mean altitude of the Antarctic ice cap (~2000 meters) produces nearly a 20 degree abrupt temperature gradient with the dry adiabatic lapse rate. This high and dry region is approximately 9 percent of the total surface area of the Earth. The Blue curve then is effectively the moist air/liquid ocean envelop that would produce the radiant impact of changes in atmospheric chemistry. With the Antarctic high and dry, a dry air only model of CO2 impact would be required to produce reasonable estimates.
The zonal imbalances are more "weather like" in their impact.
This chart uses the Reynold's OI v2 data in 60 degree longitude bands to show the noisy relationship of zonal regions over the past 3 decades. The anomaly is created be subtracting the SST data from the seasonal signal of each band.
This chart shows the raw data for each band in estimated Wm-2. The Pacific and Atlantic zones show the seasonal sine wave with the India Ocean region (0-60E) show a more complex combination of signals.
The Eastern Pacific and the Middle Eastern Latitudes have the largest noise component (weather) of the zonal regions. The Eastern Pacific has the great ocean area of these two regions and should have more climate impact because of the greater thermal mass.
The Western Pacific has less noise and would appear to be a better proxy to climate change instead of weather changes. In this chart the warming from beginning of the data to 1998 is clear as is the "pause" or plateau in warming following the 1998/1999 El Nino climate shift.
With the Western Pacific as a control region, the Western Pacific minus the Atlantic, the longer term oscillation indicator, could be a good indication of zonal impact on climate. From the ~1994 valley at -2 Wm-2 to the ~1999 peak at 2 Wm-2. global temperatures as measured by HadCRU increased by ~0.2 C degrees. With virtually no change from the ~1999 period to the ~2012 period, there is likely more Atlantic influence than Western Pacific on the estimated "average" global surface temperature.
Focusing on the Atlantic band in this chart, the overall trend is 0.639 C per century likely caused by thermal energy transfer lag created by the Drake Passage and Bering Strait choke points.
It would appear there may be much more to climate change than well mixed greenhouse gases.
Update:
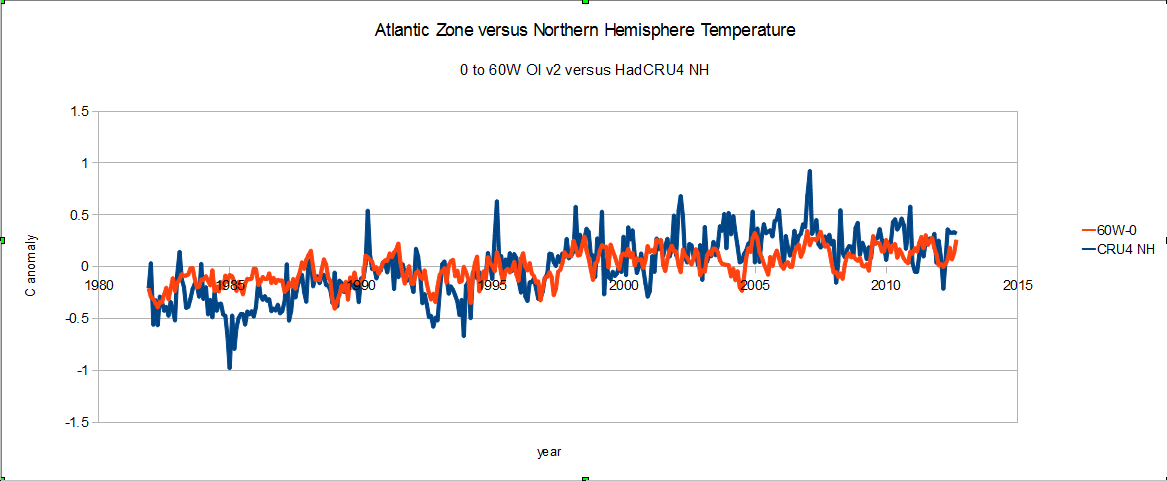
While I am more concerned with the energy imbalances many like to see temperature anomaly. This compares the 0-60W Atlantic SST zone temperature to the HadCRU4 Northern Hemisphere surface temperature anomaly. There is a pretty fair correlation as you can see and also there is a difference in the trends.


No comments:
Post a Comment