I deleted a post because I found an error in one of the spread sheets. It was live for a while, but no visitors that I am aware of, so it got canned. Typically I leave all my ugly messes, but it would have been a pain to replace the charts, so DO Over :)
Herbert et al. 2010 has a fine collection of tropical sea surface temperatures. In order to illustrate a few points, I am using Herbert et al. which I have detrended and converted to anomaly. Since the data points have irregular intervals, the detrending is not precise, but should be good enough for my purposes.
First, here are all the Herbert et al. series plotted on one axis with one, South China Sea including a linear regression to show that the detrending is pretty close.
Here I killed all but the Eastern Pacific and South China Sea reconstructions. Highlighted are a rising trend from a perturbation which is somewhat disorganized and the falling trend into the last glacial maximum which is more synchronized or organized if you prefer. Just like the El Nino Southern Oscillation, the Eastern and Western Pacific shifts with respect to one another changing climate patterns or regimes.
In this chart I have added an estimate of orbital precession which is not to scale and the Pahnke and Sachs calibration of the Sikes et al. 1993 Southern ocean reconstruction, Core MD97-2120 - 5-32S 174-55E 1210m water depth. The Sikes reconstruction shows considerable correlation with the orbital precession.
This plot compares the Tropical Atlantic to the Eastern Pacific. The Atlantic reconstruction shows some correlation to orbital and a longer settling time with more overshots of the eastern pacific trend. Prior to the perturbation ~125ka, the Atlantic had a series of tight overshots and near the exit from the last glacial maximum there was a large overshot of the Eastern Pacific which delayed exit from the LGM. The Eastern Pacific turned toward interglacial ~20ka before the Atlantic and off cycle with precession.
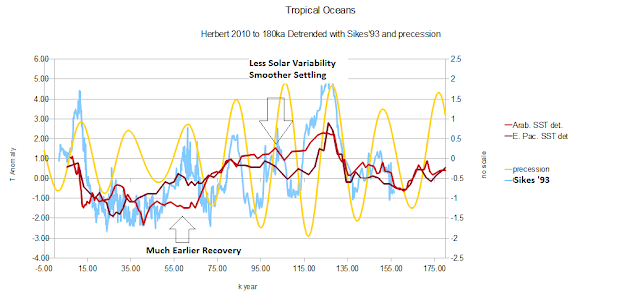
In this chart, the Arabian Sea temperatures appear to have less solar correlation and a much smoother settling from the ~125ka perturbation. The Arabian Sea also tended to stabilize at lower temperature earlier and begins a gradual increase toward interglacial conditions.Note how closely the Arabian Sea Anomaly tracks the Eastern Pacific Anomaly.
Looking at just the Sikes'93 and Eastern Pacific, the Sikes reconstruction appears to have found a basement or minimum anomaly where it did not respond as strongly to orbital forcing. This is likely due to Antarctic Sea Ice extent and/or Antarctic Circumpolar Current efficiency reducing the rate of ocean heat loss/uptake near the southern pole.
In this chart all of the Herbert et al. reconstructions are shown with the Sikes'93. There is a rather tight range of temperatures +/-2 degrees which if it were not for the more severe bottom of the last glacial minimum would have been closer to +/-1 degrees.
Over the full 455 k years used in this post, the rather tight range was maintained. This would indicate a preferred range of temperatures or possibly the elusive "Strange Attractors" of the climate system.
The Update: The Solar data is not my forte so I am not vouching for the accuracy but it appears fairly close. The plots use 40S orientation instead of 65N with both precession and obliquity not to any particular scale relative to the temperatures. You be the judge.


No comments:
Post a Comment