The title is blatantly stolen from the Climate Etc. Blog. There is uncertainty and there is uncertainty or ignorance. The "Pause", is the climate shift that started in 1995 though it probably started in 1990 and was interrupted by Pinatubo. So the "significance" of the "pause" is now the new rehash on Climate Etc.
Sequential Linear Regressions (SLR) is a way to "Gut Check" a trend significance. Scientist don't like that kinda talk, they want peer reviewed proof, but once again into the lack of peer reviewed breach.
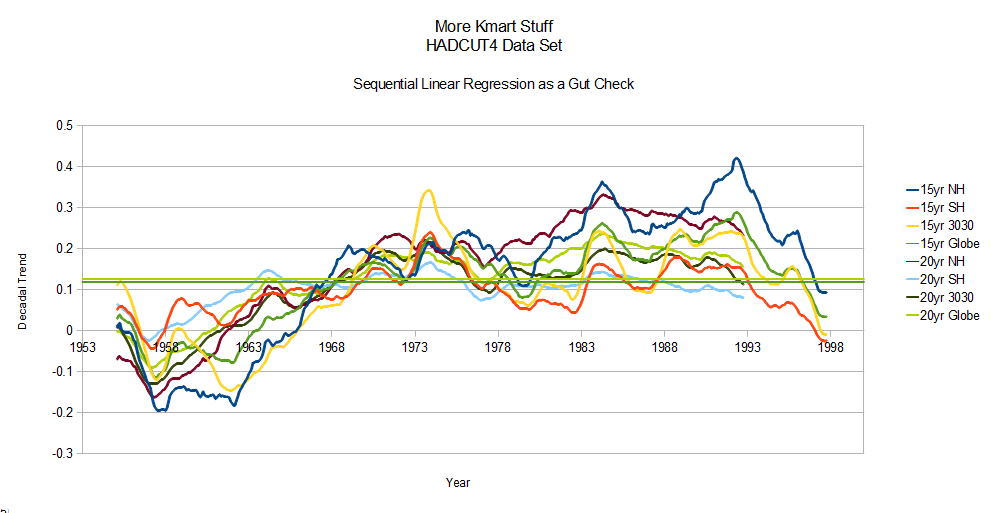
First, using just one data set and the "average" of that data set to boot, when determining the significance of a trend is just plain stupid. So this rehash is another "Stupid" discussion. Stupid is not always the same as ignorance. The chart above has the 15year and 20year SLR for the new HADCRUT4 surface temperature data set. The units on the y axis are decadal trends in degrees C for each point with the start date on the x axis. The mean value for the "Global" series is shown which indicate a reliable "mean" regression slope from 1955 of ~0.12 for the 20 year and ~0.13 for the 15 year curves. That should be pretty straight forward.
The difference between 0.12 and 0.013 is small, indicating that there is not enough statistical difference between 15 year trends and 20 year trends for this portion of the "average" of this time series, to worry about.
By hiding the "global" curves but leaving the mean value lines, you can compare the most noisy, NH means to the least noisy, SH means, which gives a range of ~0.08 to ~0.16, or a 0.08 range of uncertainty above and below the ~0.125 mean of the "average" "Global" temperature SLR. Without knowing the physical processes causing that range of uncertainty, 0.08 to 0.16 would be your range of "ignorance". Since the mean of the "average" is ~0.125 and there is a +/-0.04 ignorance range, you can be fairly certain that there is a trend of at least 0.085 but likely less than 0.165 for the HADCRUT4 (66% confidence) data from 1955 to present.
There are plenty of other "peer reviewed" methods that can be used, but this is a very simple, "gut check" method that is in keeping with,
Exploratory Data Analysis (EDA), which is basically, LOOKING at the data.
Nearly forgot, the same SLR comparison from 1900 with 32 year regressions shows a mean slope of ~0.08 per decade, the current ~0.8C of total warming. The difference between the 1900 to present ~0.08 and 1955 to present ~0.125 is 0.045 producing the roughly same 66% confidence level ( 0.08 to 0.17 instead of 0.16).


No comments:
Post a Comment